

Google Analytics 4 (GA4) significantly simplifies tracking social media traffic and user interactions on your website. Understanding how to track social media in Google Analytics is crucial for businesses, especially considering that 76% of consumers make purchases influenced by social media content. GA4 offers insights into how social media users engage with your site, enabling you to optimize your marketing strategies and improve conversion rates. By understanding the actions taken by visitors from social media, companies can tailor their content and advertisements better to meet the needs and interests of their target audience, driving sales and enhancing their online presence.
Table of contents
- How to Track Social Media With GA4?
- How to Find Social Media Traffic in GA4
- How Does Social Media Traffic Compare to Other Traffic Sources?
- Which Social Channels Are Sending Us the Most Traffic? The Best Traffic?
- Which Social Media Campaigns Are Attracting and Converting Visitors?
- How Is Paid Social Traffic Different From Organic Social Traffic?
- How Is Social Traffic Different for Mobile and Desktop Visitors?
- Conclusion
- Frequently Asked Questions
How to Track Social Media With GA4?
The Traffic Acquisition reports on GA4 show details about your social media traffic, whether free (organic) or paid, based on your campaigns. This report gives you a summary of all the visitors you get from social media for free.
GA4 automatically recognizes both free and paid social media visits. That’s why you’ll see terms like “Paid Social” and “Organic Social” in your reports.
For a deeper understanding of enhancing your social media presence, consider exploring social media marketing & management services for tailored strategies.
If you want to know how to track social media in Google Analytics effectively, adding more details to your report is essential. By specifying the source of sessions or the campaign name, you can precisely determine the origins of your paid social media visits. Adopting a robust digital marketing strategy for businesses looking to refine their approach can be a game-changer.
You can look at different numbers to see how well your social media visits are doing, like how many times people interact with your site, how many pages they look at, how long they stay, how many times they complete a goal and other important info. Staying updated with the latest social media trends can further enhance your strategy.
If you don’t see “Paid Social” in your Traffic Acquisition report, it might be grouped under “Organic Social” or not assigned. There’s a guide on how to sort out unassigned traffic if you need it.
But, if you want to see the numbers for each social media campaign by itself, you’ll have to make a custom report. For those focusing on paid campaigns, understanding the nuances of a Facebook ad strategy can provide a significant advantage.
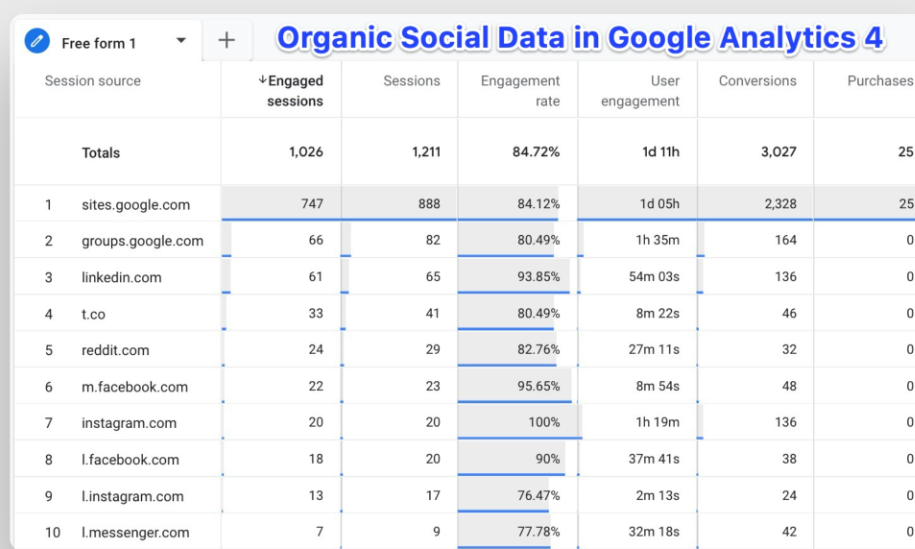
How to Find Social Media Traffic in GA4
To learn how to monitor your social media visits and the actions visitors take on your site using GA4, follow the easy guide below.
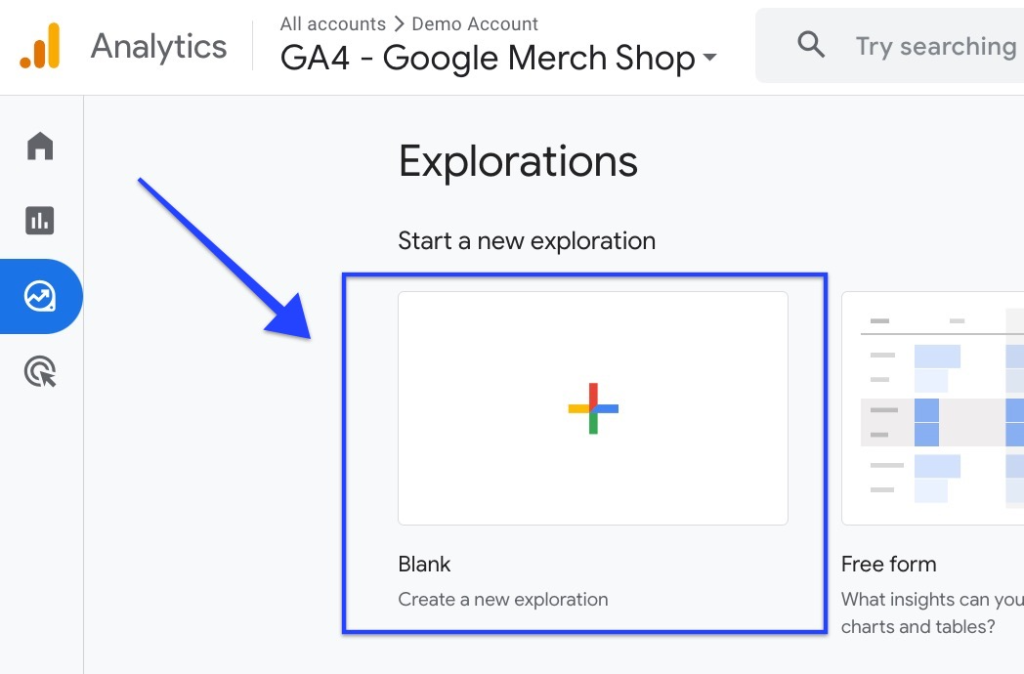
Create a New Exploration
Click on the “Explore” option in the left menu. Next, choose the “Blank template” to start a new exploration.
Import Dimensions
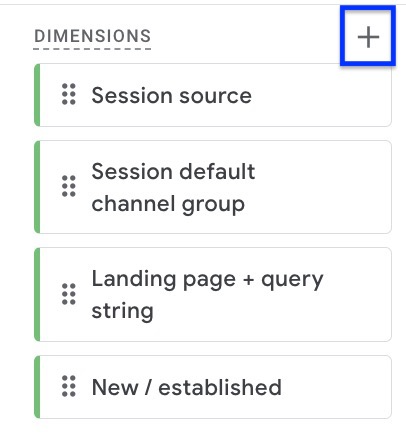
Click on the plus button near Dimensions. Then type the following dimensions in the search button: – Session source – Session default channel group – Landing page + query string – New/established. After selecting each, click on Import on the top right.
Add Metrics
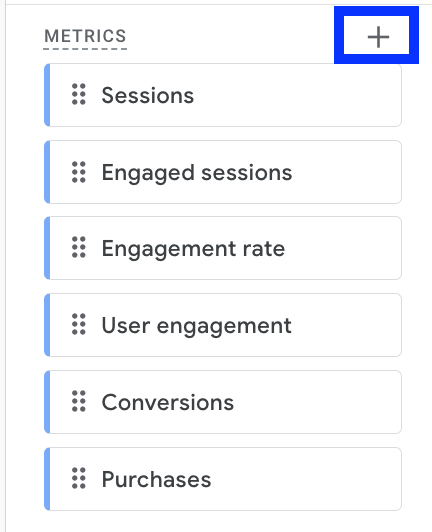
Now, click the plus button next to “Metrics.” Similar to step 2, import the following metrics:
- Engaged Sessions
- Sessions
- Engagement Rate
- User Engagement
- Conversions
- Purchases (or Transactions).
Move Session Source to Rows
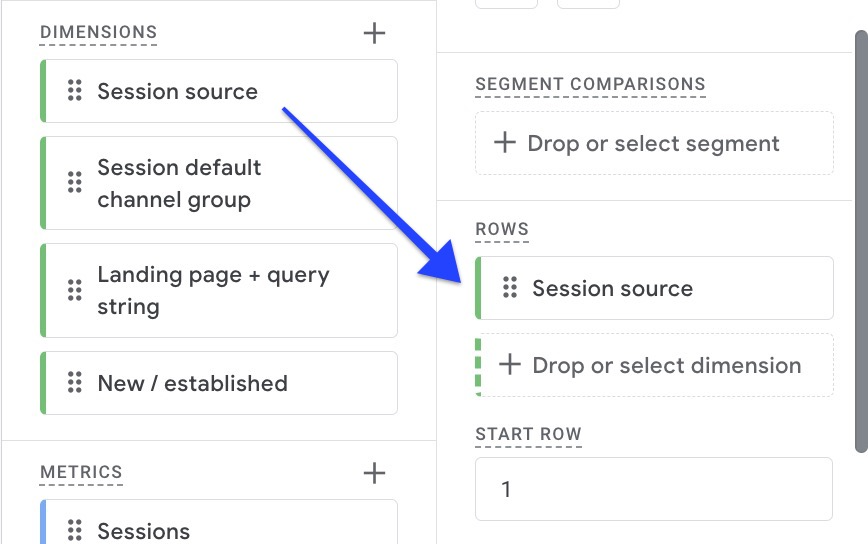
To include the “Session Source” in your dimensions, double-click it and drag it into the Rows.
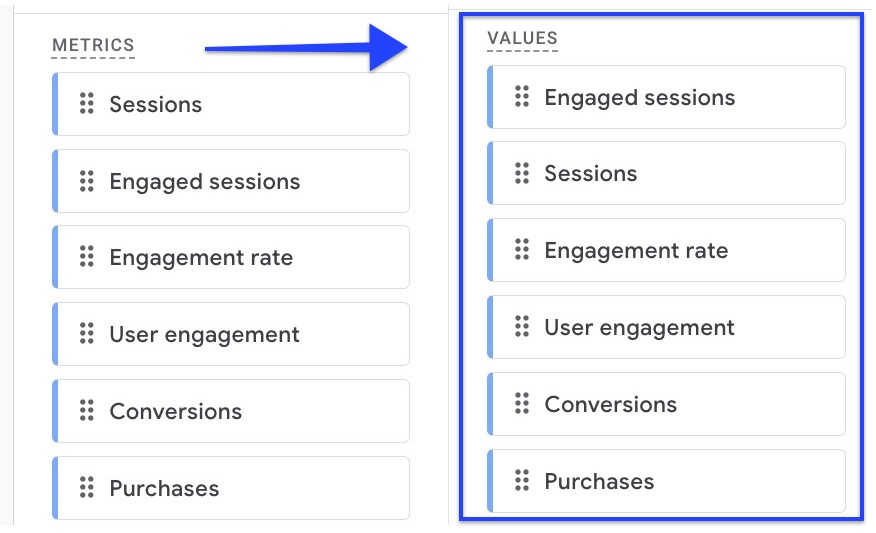
Drag All Metrics to Values
To add metrics to the Values box, double-click each metric and drag it into the box.
Filter Organic Social
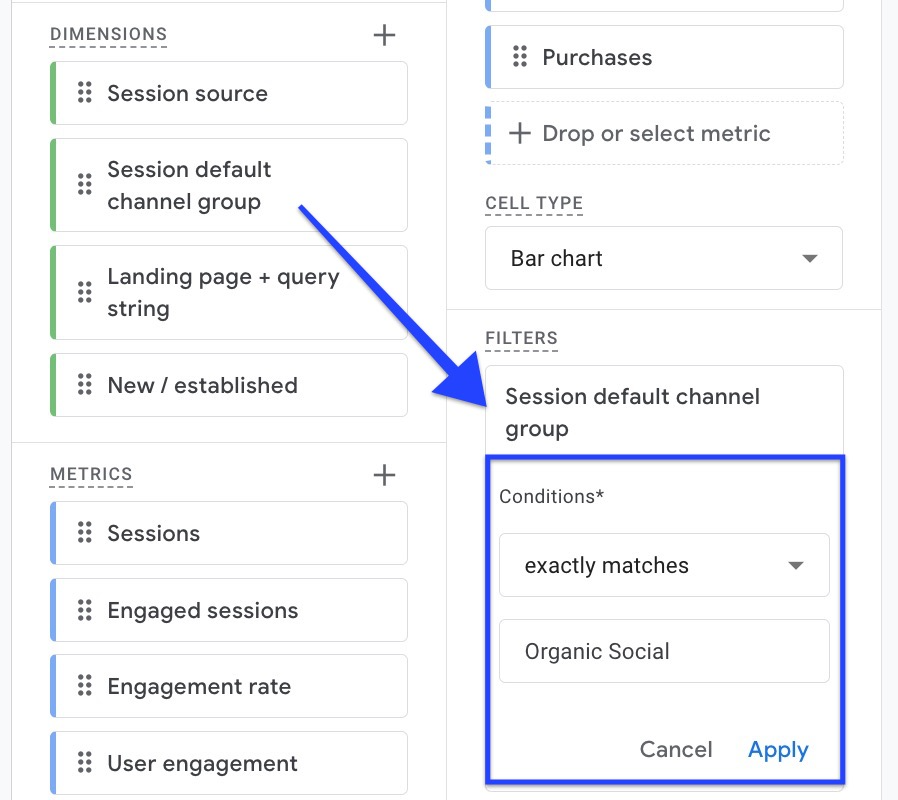
To narrow down your data, simply drag the “Session default channel grouping” from the “Dimensions” area and place it into the “Filters” section. Set your filter to “exactly matches” and choose “Organic Social” from the list of options. After setting this up, don’t forget to hit the “Apply” button.
Analyze Your Report
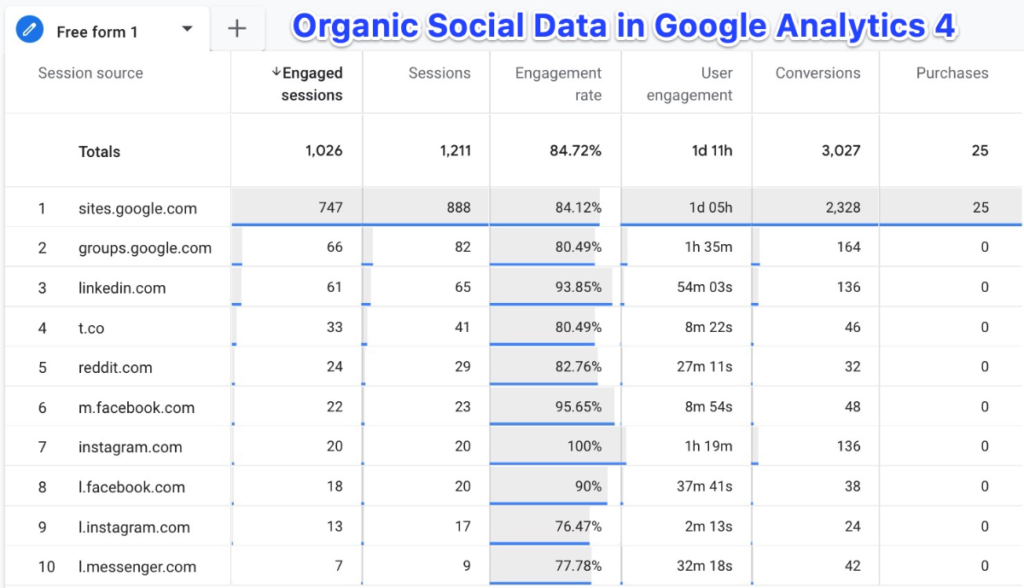
You’ve created your organic social report. If you want to see your social media traffic broken down by landing page instead of where the sessions come from, it’s a simple switch in the Rows section. Just swap out “Session source” for “Landing page.”
How Does Social Media Traffic Compare to Other Traffic Sources?
Navigate to “Acquisition,” then select “Traffic acquisition report,” setting it to “Default channel groups.”
We’ll begin with two overarching questions that provide valuable insights easily. This approach helps identify the impact of social media traffic compared to other sources using key metrics in Analytics.
The Traffic acquisition report lists “Organic social” under “Default channel groups” alongside other major traffic sources like Direct, Organic Search, Referral, and Email.
To start, from the Reports menu, choose Acquisition > Traffic acquisition. Then, to customize the report, click the pencil icon in the top right corner, revealing additional options from the right side.
Next, select “Metrics >” and choose your preferred metrics, or consider these suggestions: Users, Sessions, Engagement rate, Session conversion rate, Average engagement time per session, Event count, and Conversions. These metrics are highly recommended for comprehensive analysis and will be referenced throughout this discussion. Here’s an overview of what such customization entails.
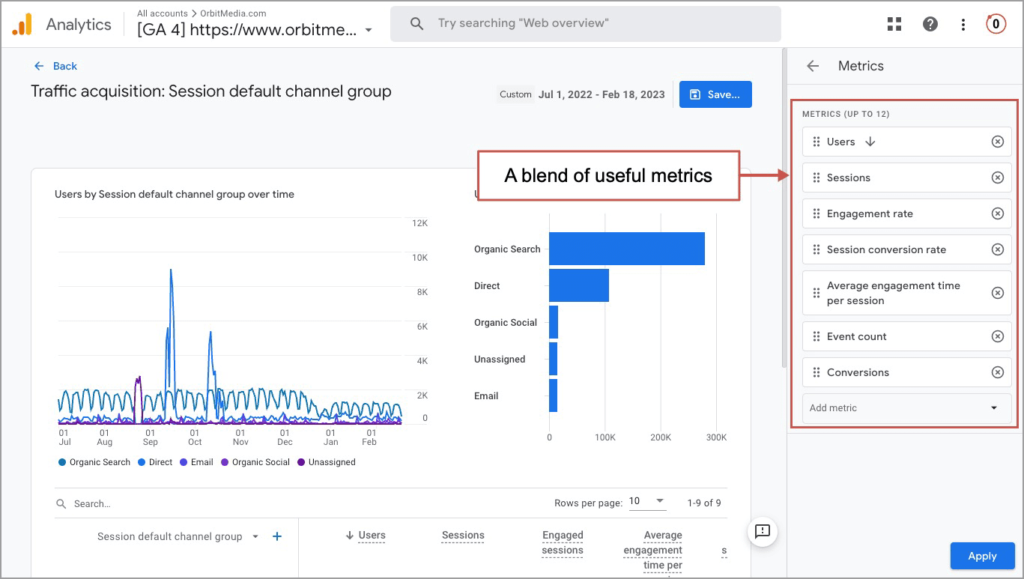
Click “Apply” in the bottom right corner, then choose “Save” to preserve the changes to the current report. Afterwards, click “← Back” in the top left to return to the newly customized report.
You can now measure social media traffic, engagement, and conversions, comparing these metrics against other traffic sources. This comparison sheds light on the unique value of social media in your overall digital marketing strategy.
Consider the following questions to evaluate your social media performance:
- How much traffic is being generated from social media? (Consider metrics like users and sessions.)
- How engaged are the visitors coming from social media? (Look at engagement rate and average engagement time.)
- How likely are visitors from social media to take desired actions? (Assess session conversion rate and conversions.)
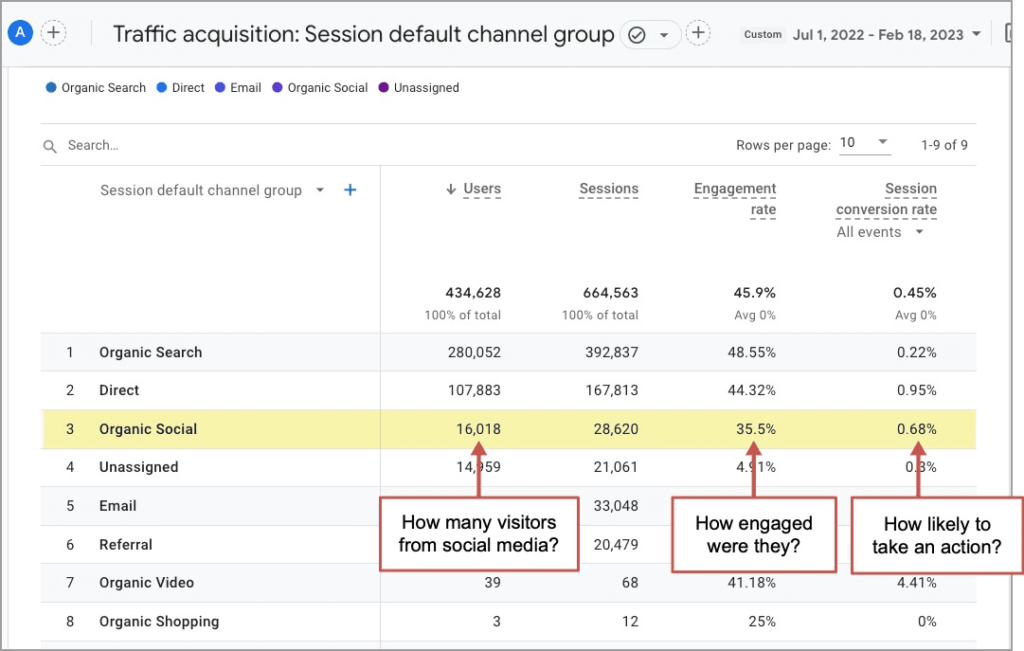
This account focuses on organic social media traffic; no paid social media traffic data exists.
When examining conversions by scrolling right, I can choose any goal from the dropdown menu. Over the past six months, social media has contributed to gaining 370 email subscribers but only four contact form submissions. Linking conversions to their traffic sources is known as “attribution.”
Expect the following observations:
- Social media visitors’ conversion rates may be lower than those from other traffic sources, such as search or direct traffic. This is often because social media users typically exhibit lower purchase intent.
- The conversion numbers might appear small. If this is the case, consider extending the analysis period. However, be mindful of seasonal trends and any changes in marketing strategies that could affect the data.
Which Social Channels Are Sending Us the Most Traffic? The Best Traffic?
To learn how to track social media in Google Analytics and to analyze traffic acquisition specifically for social media sources, follow these steps within the same report by adjusting the dimension and applying a filter for social traffic:
- Navigate to the Reports section and select Acquisition > Traffic acquisition.
- Click the pencil icon in the top right corner to customize the report, where additional options will appear from the right.
- Choose “Metrics >” and either select your preferred metrics or use the suggested metrics: Users, Sessions, Engagement rate, Session conversion rate, Average engagement time per session, Event count, and Conversions.
- Click “Apply” in the bottom right corner.
- Save the changes to the current report, then click “← Back” in the top left corner to return to your newly customized report.
- In the dropdown menu above the first column, switch the dimension from “Default channel group” to “Source.”
- Click “Add filter +” and configure it to show only traffic where the “Session medium” equals “social.”
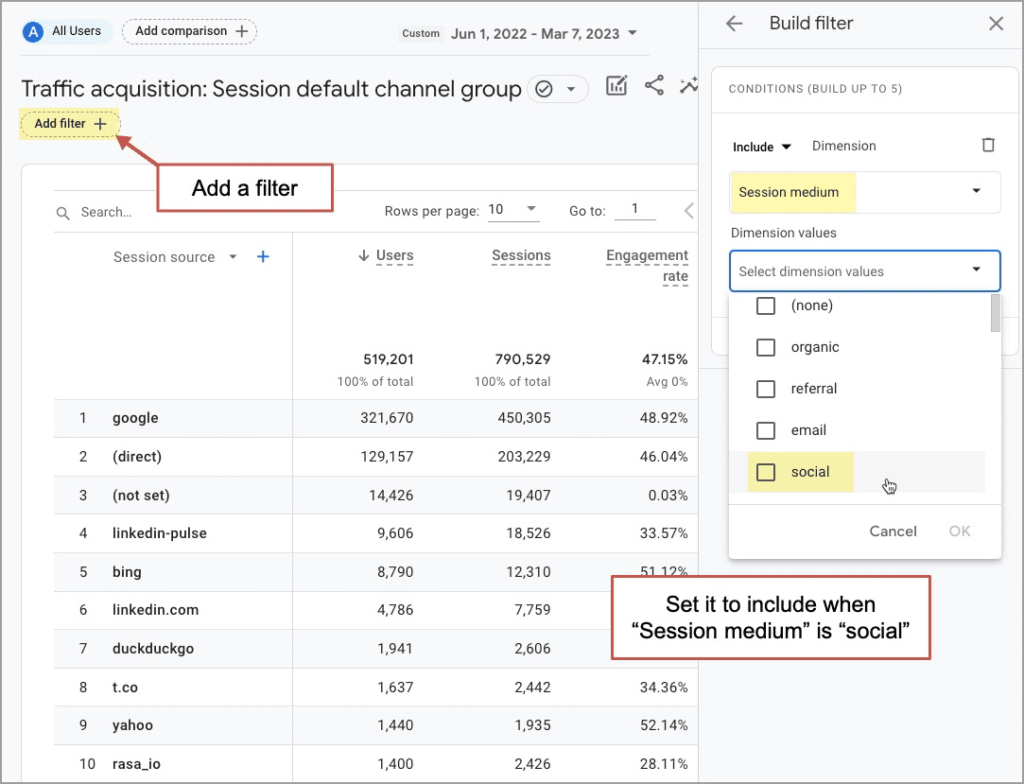
You’re now viewing a list of social traffic sources encompassing various social channels and campaigns labelled as social. This setup allows for an effortless comparison of these sources side by side.
- Identify which sources are drawing in more visitors. Observe the significant differences in traffic volume among them.
- Determine which sources are bringing in more engaged visitors. Pay attention to variations in engagement and conversion rates across these sources.
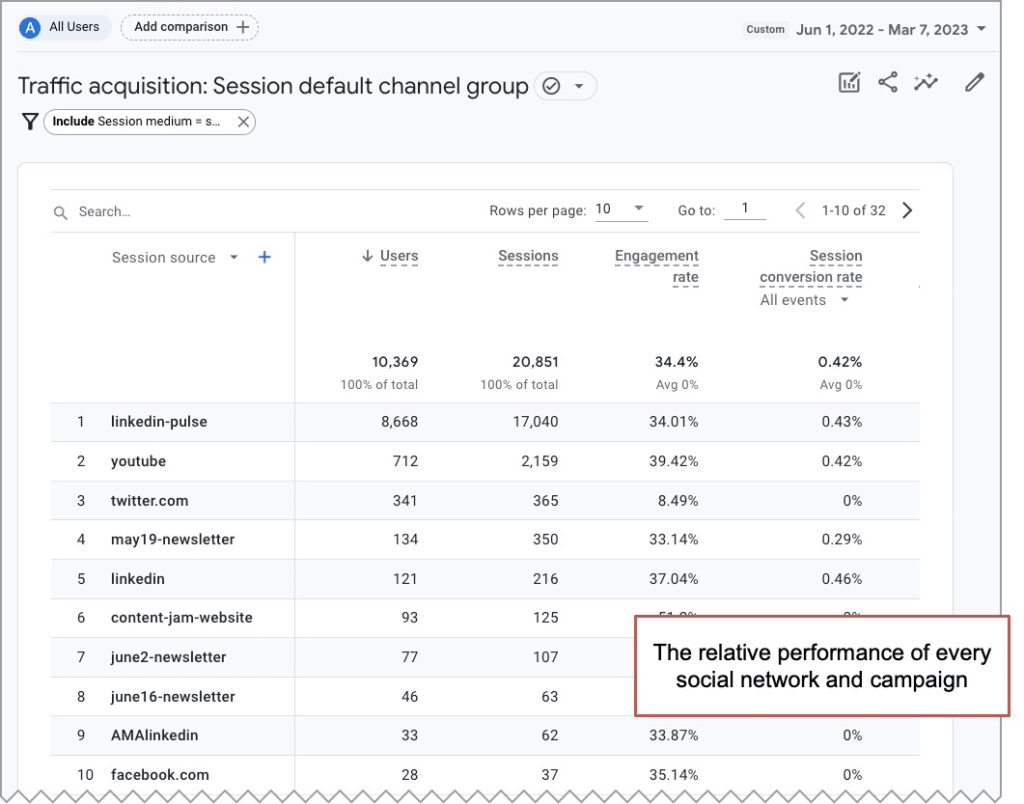
Expect some surprises:
- You might get visitors from social media sites where you don’t even post. These sites can still send people to your website if someone else shares a link to it.
- Instagram might not send many people your way, but the ones who do come might pay attention to what you say.
- Pinterest could be a great way to get more visitors than you thought!
Which Social Media Campaigns Are Attracting and Converting Visitors?
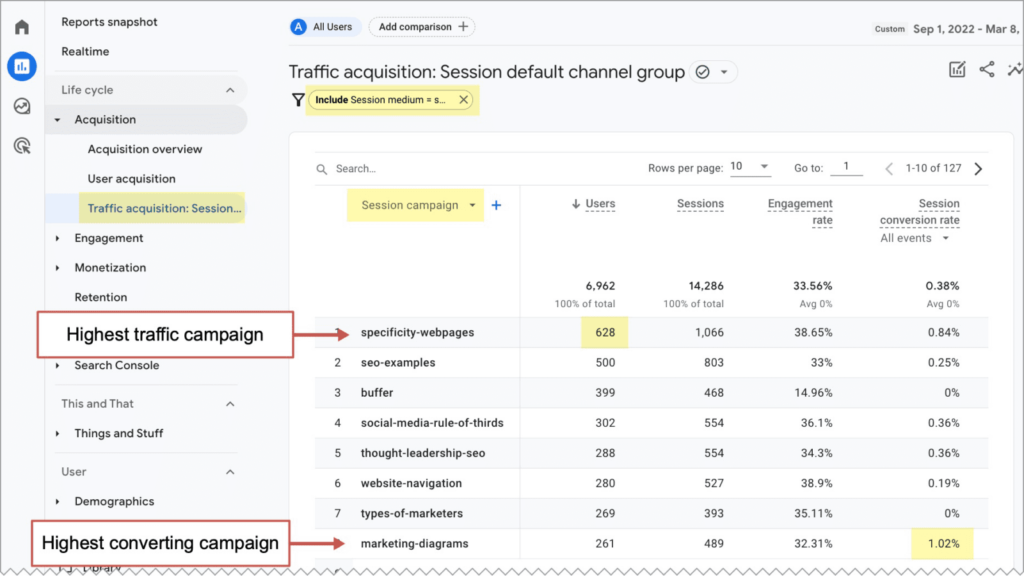
Go to Acquisition > Traffic acquisition report and set it to “Session campaign.”
Some marketing activities are important to track on their own. For example:
- Traffic from ads or sponsored posts on social media like Facebook.
- Visitors coming from a video you posted on social media.
- Visitors from working together with a famous person on social media.
In Google Analytics, a visit from a campaign means someone came to your site from a link with special tracking codes known as UTM parameters. These are added to the link with something called a Campaign URL Builder.
Google Analytics uses these codes to determine whether the visit is connected to a specific campaign. This way, you can see which social media activities brought which results.
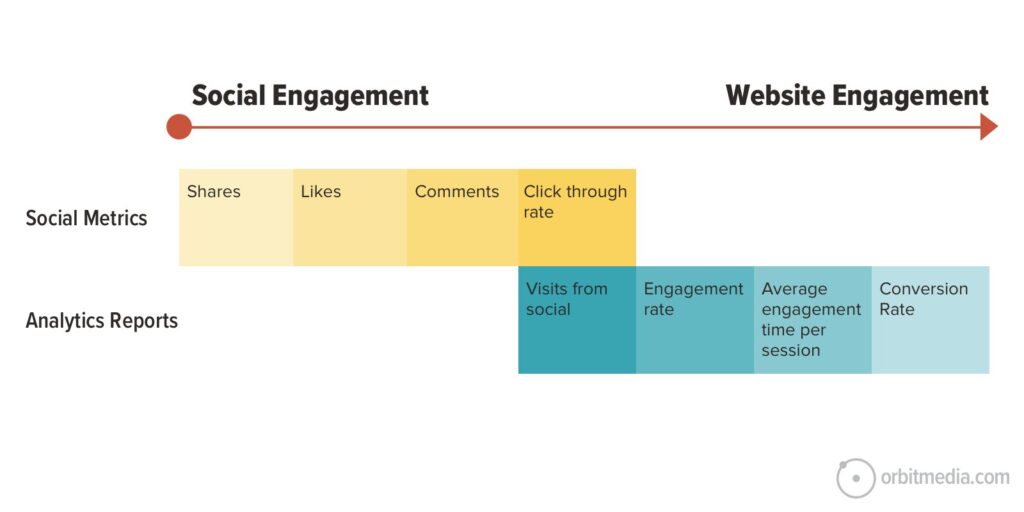
Source: orbitmedia.com
If you don’t use tracking codes, Analytics won’t be able to tell you exactly how well different campaigns are doing regarding visitors, how much people interact, and how many take action. So, adding special codes to your links in social media campaigns is important.
Here’s a simple way to check how your social media marketing, both paid and free, is performing:
- Open the Acquisition > Traffic acquisition report.
- You can change the report to show what you’re most interested in, like the number of visits, how engaged people are, and how many do what you want them to do (like signing up or buying something).
- At the top of the first column, there’s a dropdown menu. Change the setting from “Default channel group” to “Campaign source.”
- Click “Add Filter +” to focus on social media traffic.
- Choose “Session medium” for the type of data to look at.
- Enter “social” as the data detail.
- Click “OK.”
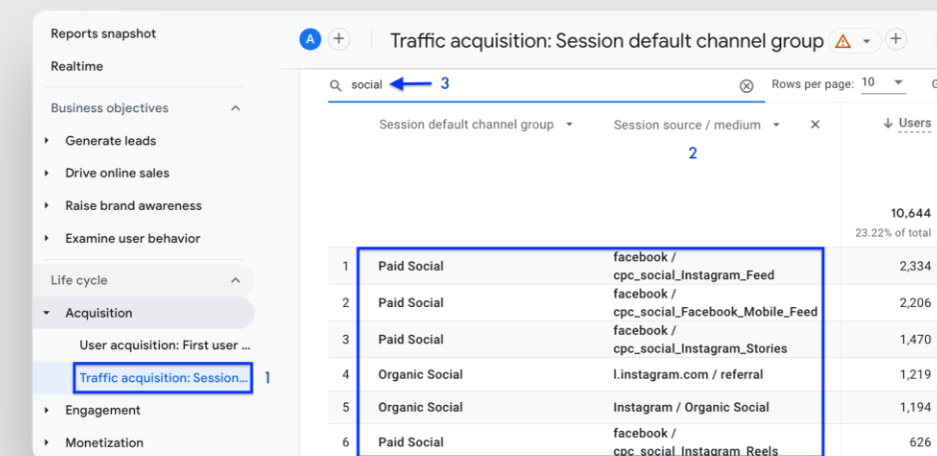
How Is Paid Social Traffic Different From Organic Social Traffic?
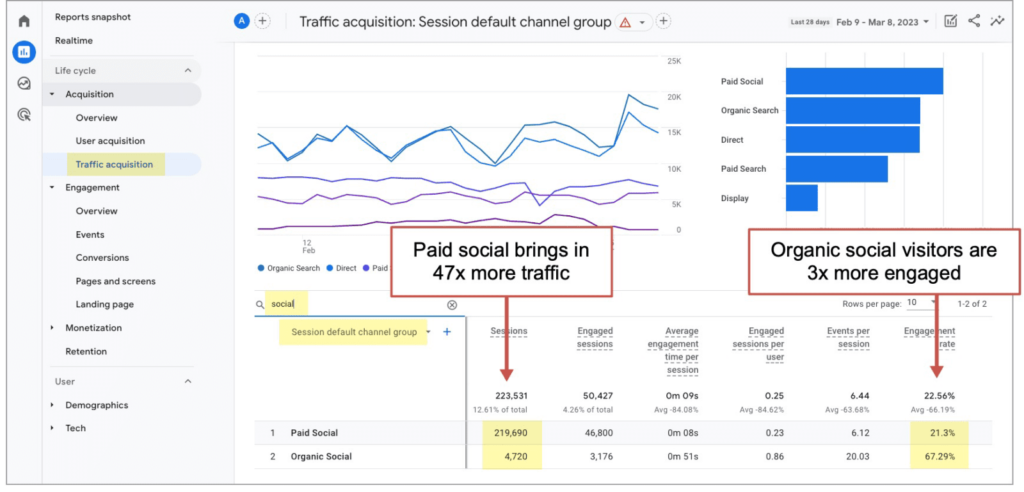
Checking out your social media traffic in GA4 (Google Analytics 4) is simpler than in the old version because it divides social media into two types: Organic social (free) and paid social (ads).
You can quickly see how each type is doing with a few steps:
- Go to the Reports area and select Acquisition > Traffic acquisition.
- You can change the report to show the number of visits, interested people, and who do something you want (like buy or sign up).
- Just type “social” in the search box above the first column of the report.
- That’s all! With just three clicks and a little typing, you’ll immediately see how your social media efforts are doing.
How Is Social Traffic Different for Mobile and Desktop Visitors?
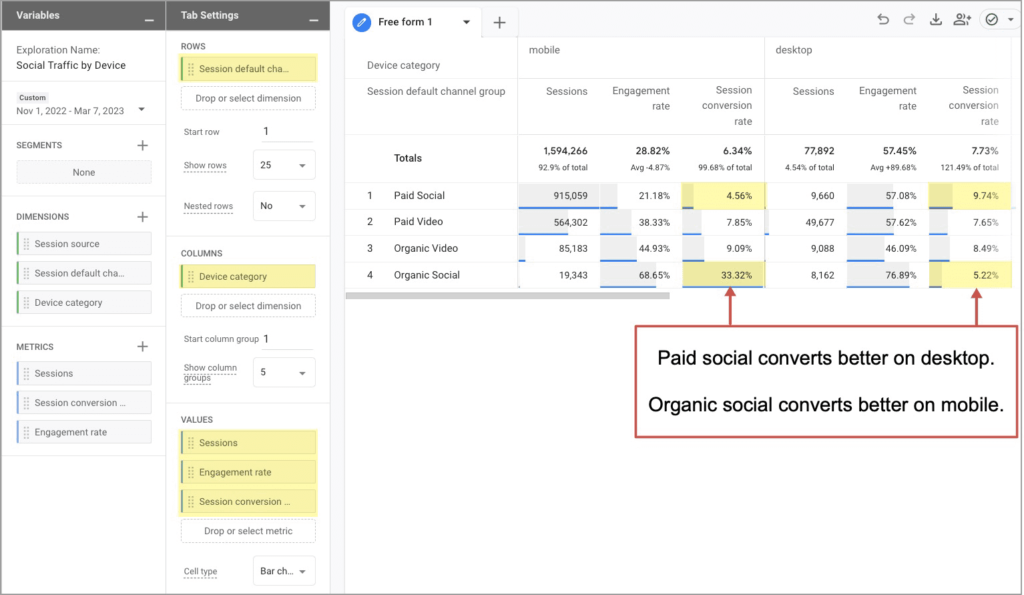
To understand how to track social media in Google Analytics effectively, let’s create a custom report to analyze the performance of various traffic types across different devices. We’ll look at the number of visits, how engaging they are, and how likely they are to get people to buy or sign up. We’ll use an Exploration in Google Analytics to do this from scratch.
Here’s how to set it up:
- Click on “Explorations” and choose “Blank” to start fresh.
- First, we need to pick what details we want to see. Click the plus sign next to DIMENSIONS and look for “Session default channel group” and “Device category.” Select both.
- Now, let’s pick what numbers we want to see. Click the plus sign next to METRICS and add “Sessions,” “Engagement rate,” and “Session conversion rate.”
- Move the “Session default channel” detail into the ROWS box. This will show us the type of traffic.
- Drag the three numbers we picked into the VALUES box. This will show us the data for each type of traffic.
- Put the “Device category” detail into the COLUMNS box. This will separate the data by the device people use, like phones or computers.
- If you want to make the report cleaner, you can right-click on any traffic type in the report and choose “exclude selection” to hide it. For example, I only kept the social media and video traffic types visible.
Conclusion
GA4 has a lot to offer, but it can take some time to learn how to use it. It’s a strong tool for checking how well your social media ads work. If you set up GA4 correctly, you can use its features, like events and parameters, to learn more about what your audience does and how your social media ads help bring in more visitors and sales.
For businesses looking to enhance their online presence, digital marketing in Canada can provide the necessary expertise to maximize GA4’s potential. If you have questions about social media services, contact our team and get a CDAP free consultation today.
Frequently Asked Questions
Google Analytics 4 shows where your social media visitors come from, telling apart the free clicks from posts and profile links (Organic Social) and the clicks from paid ads (Paid Social).
Paid social media means people visit your site or app through ads like Facebook and Twitter. Organic social comes from regular, unpaid activities on those social sites.
There is no limit to the number of events with different names for web data streams.
30 minutes