


Google AdWords Benchmarks By Industry 2016
Have you been using Google Adwords to promote your business? If you have, do you feel confused about tons of data in your reports? CTR, CPC, CPA . . . how to interpret them can be daunting! It is especially difficult when you don’t have an industry benchmark to compare. Is 0.5% CTR good or bad? What’s the difference between benchmarks for Google Search Network and Display Network? It all depends on the Google AdWords Benchmarks.
Early this year, WordStream released a detailed infographic on Google Adwords industry metrics such as average clickthrough rate (CTR), average cost-per-click (CPC), average conversion rate (CVR), and average cost-per-action (CPA).
The study was based on a sample of 2,367 US-based companies with USD$34.4 million in aggregate Adwords spend in Q2 2015. It covers 16 industries including eCommerce, Finance & Insurance, Travel & Hospitality, Auto, Home Goods, and Health & Medical, etc.
The original infographic is visual but hard to read with so many numbers. Thanks to Hubspot, they have compiled 4 lists based on WordStream’s infographic which make it very easy to digest.
This information can help you improve your campaign performance and develop effective strategies to get most out of your Google Adwords budget. Make sure you save it and keep it handy 🙂
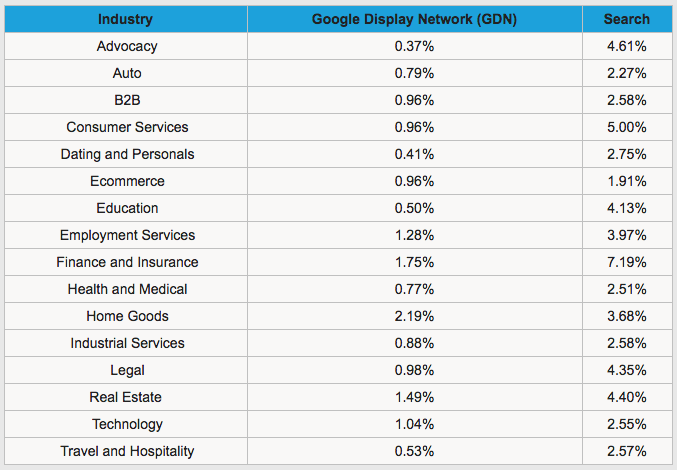
Average Clickthrough Rate (CTR)
CTR is the number of clicks that your ad receives divided by the number of times your ad is shown: clicks ÷ impressions = CTR. For example, if you had 10 clicks and 1000 impressions, then your CTR would be 1%.

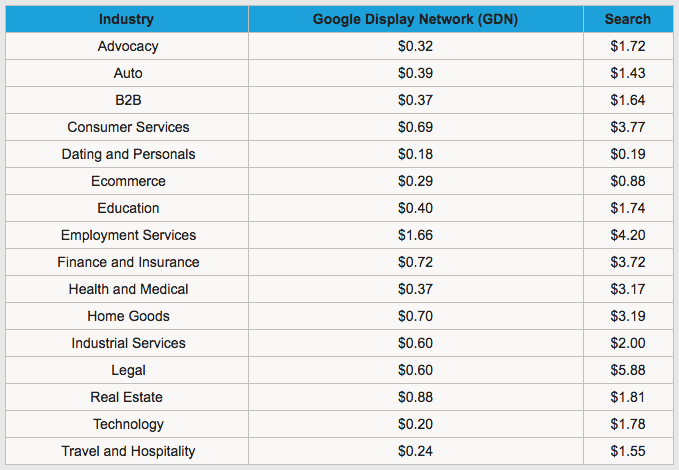
Average Cost-per-Click (CPC)
CPC is the amount you’re charged for a click.
Average Conversion Rate (CVR)
Average conversion rate tracks the number of conversions you get from a certain ad.
Average Cost-per-Action (CPA)
Average cost-per-action (also known as cost-per-acquisition) refers to the amount you pay every time an action is performed involving your ad.