

Let’s start with the basics.
What is CRO?
CRO is the abbreviation for Conversion Rate Optimization. It refers to the process of improving the conversion rate by modifying the website or application.
For example, if 10 out of 200 people who visited your website turned into a conversion (purchased your product, fill out your form or called you), then your conversion rate is 10/200. With CRO (Conversion Rate Optimization) you can further increase this rate to 10/150 or even 10/100 by improving your website.
Google Analytics tracks everything that happens on your website. By being able to see this data, you can further optimize your site to increase your conversions.
So how do these key metrics relate to conversions?
Let’s run through an example that contains each and every one of these 9 Google Analytics key metrics:
Pretend Noah is looking for an internet provider. He starts surfing Google to see what’s available.
Noah clicks on the first page he sees (4. New user) but it turns out that it’s completely irrelevant to internet providers, so he exists out before even browsing to another page (1. Bounce Rate).
He continues to research and notices another internet provider that he was looking at the day before (4. Returning user), but now they are offering an amazing deal, 1-month for free (remarketing), however, when Noah clicks on it he lands on a page that takes a very long time to load (7. Page Speed). He really wants to get this deal, so he clicks on the biggest red button visible (6. In-page analytics), and lands on a second page (3. Pages per visit) that is not mobile-friendly (5. Devices). Noah has been on the website for about 30 seconds by now (2. Average Session Duration), but he keeps going back and forth pages because he isn’t sure where to find this amazing, 1-month free deal (9. Behaviour Flow). He ends up his losing patience and exiting out.

Though Noah found the website because of its amazing promotion, his buying journey was not completed (8. Goal Funnel). Noah was interested in the offer, but the website didn’t give him enough incentives to turn into a conversion. The campaign was successful in attracting Noah to the website, but the landing page was not optimized properly, losing him as a conversion.
Now, what does this internet provider company have to do to make sure this doesn’t happen again? They need to investigate and analyze their website’s data to optimize their conversion rate.
Let’s dive into the 9 Google Analytics key metrics you MUST know for CRO so that this doesn’t happen to you!
1) Bounce Rate
Bounce Rate is the percentage of users that visit your website and leave after visiting one individual page, without browsing any longer. With the bounce rate key metric you can check how each page on your site performs individually and troubleshoot the problem. The rule of thumb is an ideal bounce rate of 26 to 40%.
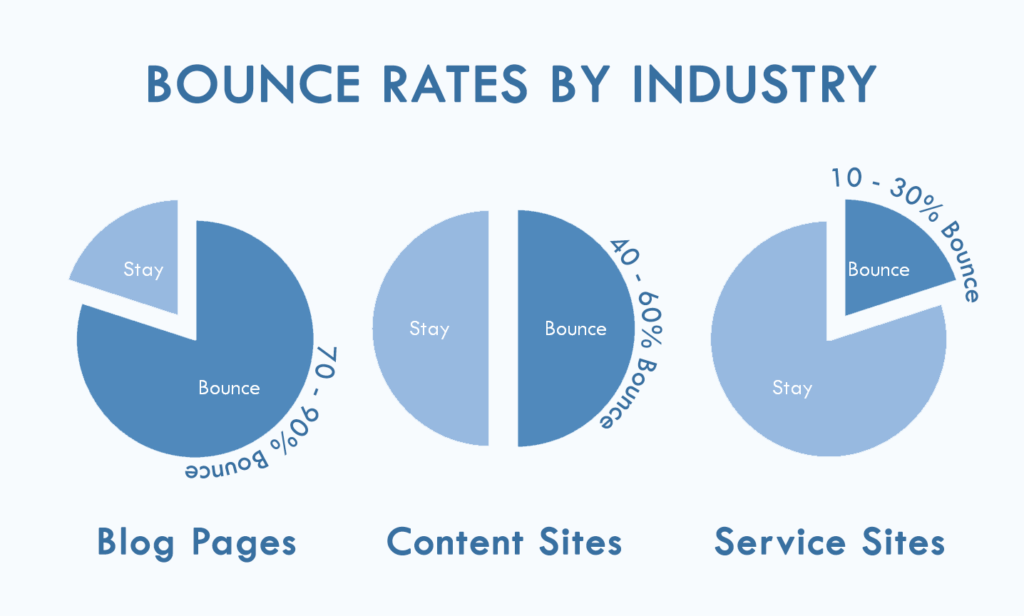
If people are leaving your website as soon as they land on a page, without surfing through other pages on your site, then you need to optimize your landing page. Your bounce rate is a powerful key metric that measures how your landing pages are performing. Relevancy is key here. The main reason why your bounce rate may be high could be that your content is not relevant to the visitor, so make sure you understand who your audience is and who you are trying to market to. Another main reason could be that your page is not interactive enough, leaving people uninterested in reading more on your website.
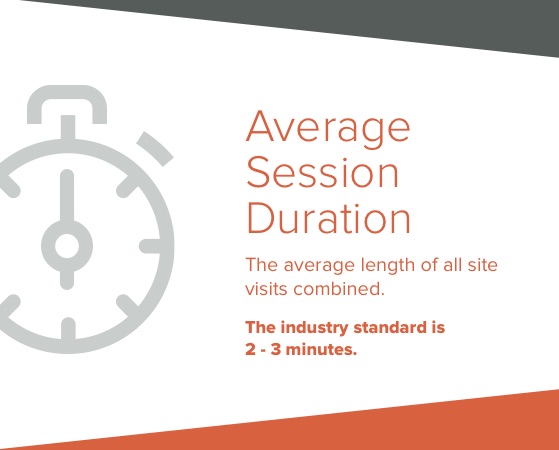
2) Average Session Duration
The session is the interactions that a user takes within a timed visit on your site. The average session duration tells you how much time was spent on your website per visit. It is the average length of all site visits combined. The industry standard is 2-3 minutes. This metric is visible to you as soon as you log into your Google Analytics account.
Check the average session duration on each page and see how each page performs. You can gather trends and patterns in how your visitor behaves and how long they send on each page of your website. Along with the bounce rate, the average amount of time spent on your website usually tells you how interesting, or engaging your content/pages are.
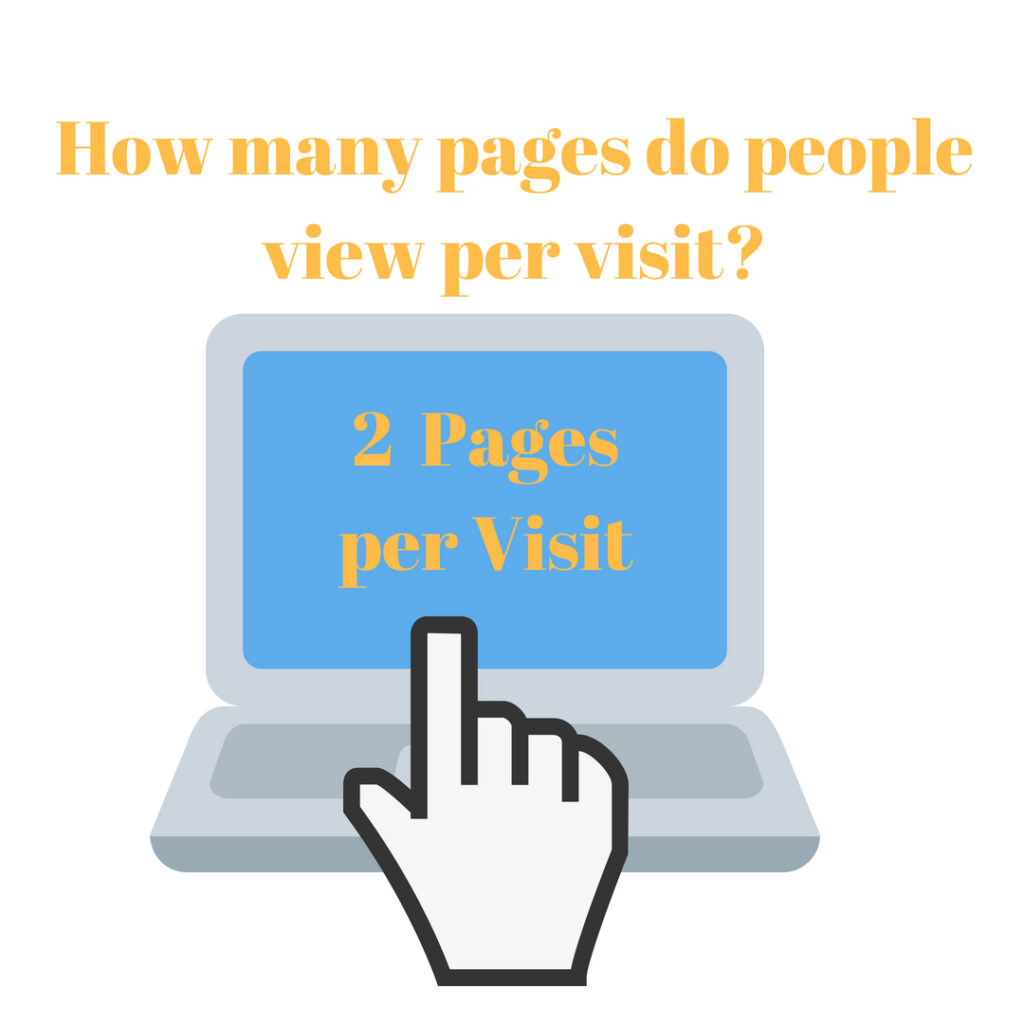
3) Pages Per Visit
This is the average number of pages that are viewed during a user’s visit to your website. It shows you how interested and compelled users are in further browsing through your site.
[mkdf_blockquote text=”People are time poor. They visit a staggering number of new websites every day, not to mention social media consumption. Unless they’re engaged, they’ll leave. Simplify everything.
The goal here is to keep users engaged and catch their attention enough so that they want to click on the next page. The more amount of pages per session means that your website is doing an excellent job at keeping your user engaged with your pages leading them from page to page. This is a great way also to measure how well your copywriting is on your site!
4) New Users vs. Returning Users
New users vs. returning users show you the average of first-time visits to your site. This metric tells you how many visits on your website are first time users, and how many are returning users. This both measures your remarketing efforts as well as your ads targeting new traffic.
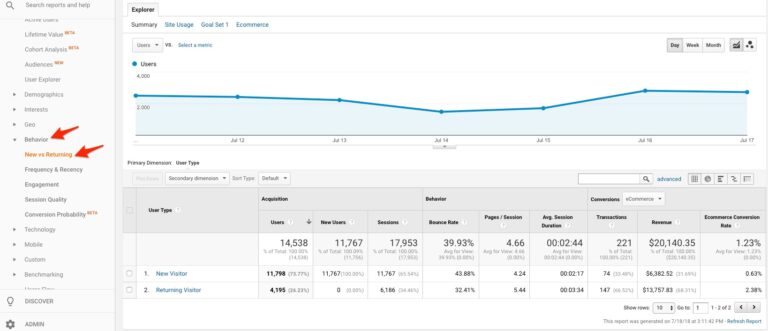
Having a healthy mix of both users is good. Having returning users shows that either your remarketing campaigns are doing well, or that your website was memorable and the user wants to return for more! However, a high percentage of returning users, but low conversions from them could mean that even though they are interested in your services/products, your offer is not strong enough.
5) Devices
Audience – > Mobile -> Overview
Having a fully responsive website across all devices is extremely important. You can see exactly which browser and devices users used by users visiting your website. This data is essential to improve your users’ experience. You can inspect each page on your site, and see the loading time for that specific browser and device. This way by identifying the main users on your websites, you can optimize their experience, and create a user-friendly and mobile-friendly site across all browsers and devices.
Google Analytics groups the mobile devices vs. the tablet, and you can even arrange them from service provider, operating system, mobile brand and screen resolution. If there are bugs for specific devices or browsers, you can fix them, and it will most likely increase your conversion rate.
6) In-Page Analytics
If you want a quick overview of the basic metrics of your website, this is your answer. In-page analytics is a Google Chrome extension that tells you what works visually and what does not on your website. It shows you the percentage of elements clicked on your site.

Many people confuse this key metric. It does not only measure content on your website but any element that you have on your site. It includes CTA, links, etc. You can create reports and customize them for different goals. You can choose the date range, a segment for results, metrics, click data, and view. Knowing where your visitors click the most, helps you know where you need to focus your optimization on your website. Most clicked aspects of your website should always be before the user needs to scroll down. The most clicked elements on your website are typically the most eye-catching ones in terms of color and copywriting, so make sure this element is a crucial part of your conversion path.
7) Page Speed
Behavior -> Site Speed
Google Analytics lets you see your site speed overview. You can take it a step further and check the speed of each page. The overview tells you average page load time and even shows you based on server connection, browser type, country, and page. Most people like to use this tool to compare different periods of time. It’s common for something to happen and have a significant drop in traffic. This is one of the many ways Google Analytics lets you investigate your site to see what is causing this drop.
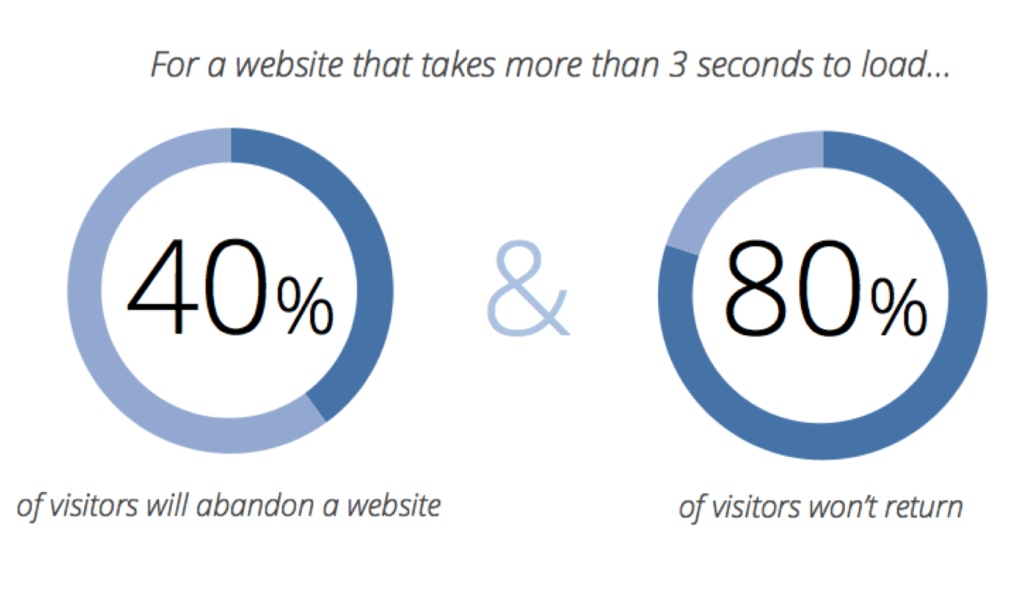
Check the loading time of each page so you can see exactly where the problem is, and which page needs optimizing to improve loading time. First, you should prioritize your most popular pages and make sure that the user experience is fast and smooth. If you haven’t checked your page speed data on your Google Analytics account, check now! You will find some revealing data here.
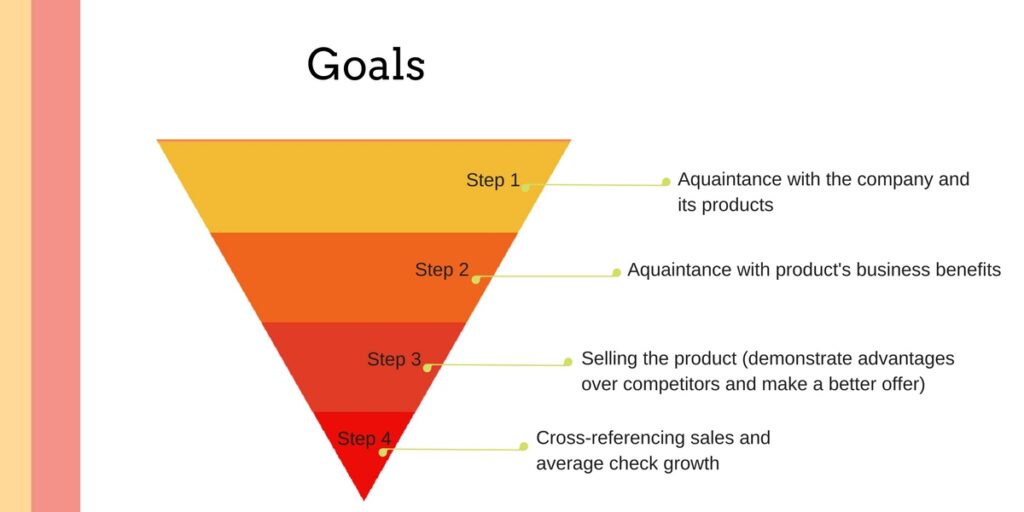
8) Goal Funnel
Goal funnels are steps that your users must take to turn into a conversion. You have to set these up on Google Analytics.
You have to define every step your users must take to turn into a conversion; Whether this is clicking on “call now,” “fill out the form,” or “add to cart,” there is a clear path for the user to become a customer. Goal Funnels in Google Analytics help you see the process that visitors must take on your website to become a customer. You can determine the steps that customers do not like or typically abandon, change the language of your copywriting to improve customer’s final decision during sign up and pinpoint any technical issues that are stopping consumers from closing the deal.
You may be wondering what the difference between your goals and your funnel goals is. Well, the funnel provides you with a lot more data than just your goals do. It tracks every step and helps you see the problems that are stopping your visitors from turning into conversions so that you can do some effective conversion rate optimization.
9) Behavior Flow
Behavior -> Behaviour Flow
Similar to the goal funnel metric, behavior flow shows you the path that your visits follow from page to page. This path includes multiple pageviews as well. It helps you to see which content is the most engaging for your users and which one is the least engaging.

Not only can you see their behavior on your website, but it also shows you how many people are browsing through it, where they are clicking as they go from page to page, and which page they are on when they exit your website. The first page they land on is known as the first interaction, the second page they land on is the second interaction and so on until they leave. You can also see how people coming from different channels behave on your website. It’s important to notice if your users are going back and forth between pages, and how long their paths are. If you notice them going back and forth, then perhaps your path isn’t very clear to them. The user should always know where they need to click next.
So which key metric is the most important?
They are all important! Analyzing your website for conversion rate optimization is no easy task! You have to take your time and study every aspect of your site. Luckily Google Analytics provides you with surprising insights into your visitors’ experiences on your website. The primary purpose here is for your visits to turn into conversions, which means that they have to have a user-friendly and smooth experience on your site.
Your next steps:
- Make sure Google Analytics is tracking your website properly
- Check each one of these key metrics on Google Analytics
- Pinpoint concerns based on users’ behavior throughout your website
- Create a conversion rate optimization plan